Long description: keypoint
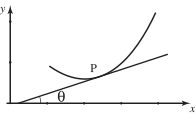
Alt text: A graph showing a curved line intersecting a straight line, with an angle labeled θ.
This description was generated by AI and has not been verified by a human. If you spot an error, please use the feedback link below.
- The image is a two-dimensional graph with the horizontal axis labeled −{} and the vertical axis labeled −{}.
- Two lines are plotted on the coordinate plane: one is a curve that resembles a parabola opening upwards, and the other is a straight line with a positive slope.
- At the intersection point of the curve and the straight line, an angle, labeled θ, is indicated between the tangent line to the curve at that point and the straight line.
- The graph illustrates the concept of an angle formed between two curves or lines at a point of intersection.