Long description: workbook11block1fig2
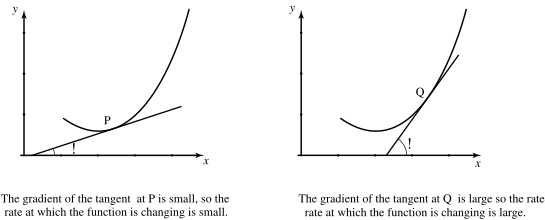
Alt text: The image shows a graph with two points, P and Q, illustrating the relationship between the gradient of a tangent line and the rate of change of a function.
This description was generated by AI and has not been verified by a human. If you spot an error, please use the feedback link below.
- The image displays a two-dimensional coordinate plane with the horizontal axis labeled with \(x\) and the vertical axis labeled with \(y\).
- On the left side, a curve is shown with a point labeled P, where a tangent line is drawn.
- At point P, the tangent line has a shallow, positive slope, indicating a small rate of change for the function.
- On the right side, the same type of curve is shown with a point labeled Q, where a tangent line is drawn.
- At point Q, the tangent line has a steep, positive slope, indicating a large rate of change for the function.