Long description: block3fig1
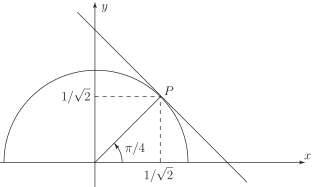
Alt text: A graph shows a circle and a line passing through a point labeled P, with right triangles indicating angles and coordinates.
This description was generated by AI and has not been verified by a human. If you spot an error, please use the feedback link below.
- The image displays a two-dimensional coordinate system with a horizontal x-axis and a vertical y-axis.
- A circle is drawn on the left side of the y-axis, passing through the point where the x-axis and y-axis intersect, and extending to a maximum x-value of \(1/\sqrt{2}\) and y-value of \(1/\sqrt{2}\).
- A straight line slopes downwards from the upper left quadrant to the lower right quadrant.
- A point labeled P is marked where the circle and the straight line intersect in the first quadrant.
- A horizontal dashed line connects the point P to a point on the y-axis, with the coordinate value \(1/\sqrt{2}\) indicated along the y-axis.
- A vertical dashed line connects the point P to a point on the x-axis, with the coordinate value \(1/\sqrt{2}\) indicated along the x-axis.
- A right-angled triangle is implicitly formed by the point P, the point \((1/\sqrt{2}, 0)\) on the x-axis, and the point \((0, 1/\sqrt{2})\) on the y-axis, although the right angle is shown relative to the axes.
- An angle labeled \(\pi/4\) is indicated between the positive x-axis and the line segment connecting the origin to the point \((1/\sqrt{2}, 1/\sqrt{2})\) which passes through P's projected location on the x-axis, suggesting a 45-degree angle.