Long description: figtan
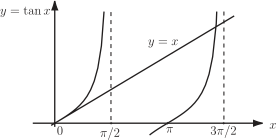
Alt text: The graph shows the tangent function, \(y = an x\), and the line \(y = x\) plotted over the interval from \(0\) to \(3\frac{\text{pi}}{2}\) on the x-axis.
This description was generated by AI and has not been verified by a human. If you spot an error, please use the feedback link below.
- The graph displays two functions plotted on a coordinate system, with the horizontal axis labeled \(x\) and the vertical axis labeled \(y\).
- The domain shown on the x-axis spans from \(0\) to \(3\frac{\text{pi}}{2}\), marked with vertical dashed lines at \(0\), \(\frac{\text{pi}}{2}\), \(\text{pi}\), and \(3\frac{\text{pi}}{2}\).
- One curve represents the tangent function, \(y = an x\), which has vertical asymptotes at \(x = \frac{\text{pi}}{2}\) and \(x = \frac{3\text{pi}}{2}\).
- The second function is represented by a straight line, \(y = x\), which passes through the origin and has a slope of one.
- The line \(y = x\) intersects the graph of \(y = an x\) at \(x = 0\) and at \(x = \text{pi}\).
- Between these intersection points, the graph of \(y = an x\) is below the line \(y = x\) in the first visible cycle segment (\(0\) to \(\frac{\text{pi}}{2}\)), and the line \(y = x\) is below the curve of \(y = an x\) in the segment (\(\text{pi}\) to \(\frac{3\text{pi}}{2}\)), although the precise relationship in the second visible cycle is not the primary focus of the intersection points shown.