Long description: workbook134fig1
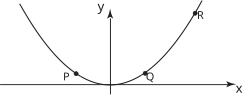
Alt text: The image displays a concave-up parabola plotted on a coordinate system with labeled points P, Q, and R.
This description was generated by AI and has not been verified by a human. If you spot an error, please use the feedback link below.
- The image shows a graph of a curve, likely a parabola, drawn on a two-dimensional Cartesian coordinate system with an x-axis and a y-axis.
- Three points are marked on the curve: P, Q, and R, positioned sequentially from left to right along the curve.
- Point P is located on the left side, near the bottom of the curve.
- Point Q is located near the vertex or the bottom-most point of the visible portion of the curve.
- Point R is located on the right side, higher up on the curve than P and Q.
- The curve itself is concave up, indicating that its curvature is changing across the visible segment.