Long description: workbook134fig4
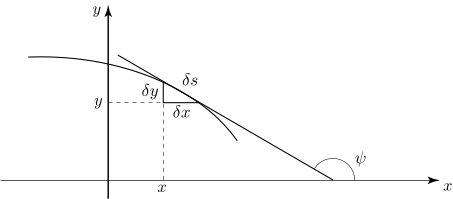
Alt text: A graph showing a curve segment with associated small displacements \(\delta_x\), \(\delta_y\), and arc length \(\delta_s\), and an angle \(\psi\).
This description was generated by AI and has not been verified by a human. If you spot an error, please use the feedback link below.
- The image displays a two-dimensional Cartesian coordinate system with the horizontal axis labeled \(x\) and the vertical axis labeled \(y\).
- A smooth, concave-downward curve is drawn across the first quadrant of the graph.
- Several small displacements are indicated near a point on the curve: a horizontal displacement labeled \(\delta_x\), a vertical displacement labeled \(\delta_y\), and the corresponding arc length displacement labeled \(\delta_s\).
- A right triangle is implicitly formed by these three displacements, with \(\delta_s\) representing the hypotenuse connecting the starting and ending points of the small segment.
- At the endpoint of the curve segment, an angle labeled \(\psi\) is shown, representing the angle the tangent line makes with the positive \(x\)-axis.