Long description: workbook134fig6
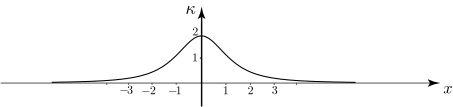
Alt text: A graph shows a bell-shaped curve plotted against an x-axis and a kappa (curvature) y-axis, with the peak centered near x equals 0.
This description was generated by AI and has not been verified by a human. If you spot an error, please use the feedback link below.
- The image displays a Cartesian coordinate system with the horizontal axis labeled with \(x\) and the vertical axis labeled with \(\kappa\) (kappa).
- A smooth, bell-shaped curve is drawn on the graph, resembling a normal distribution curve.
- The curve is symmetric and its maximum value (peak) is visibly positioned at \(x=0\), reaching a value of 2 on the \(\kappa\) axis.
- The curve gradually decreases as \(x\) moves away from zero in both the positive and negative directions, approaching the \(x\)-axis as \(|x|\) increases.