Long description: sinc
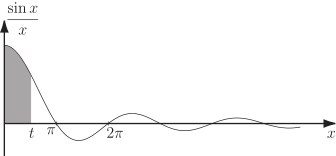
Alt text: The graph shows a shaded area representing the integral of the sine function, which forms a characteristic pattern of a positive lobe followed by oscillations.
This description was generated by AI and has not been verified by a human. If you spot an error, please use the feedback link below.
- The image displays a graph with the sine function, \(\sin{x}\), plotted against the variable \(x\).
- A shaded region is visible under the curve from \(x=0\) up to a value less than \(\pi/2\), representing a positive area.
- Following this initial shaded region, the curve continues to oscillate, showing subsequent lobes that alternately cross the \(x\)-axis and oscillate above and below it.
- The \(x\)-axis is labeled with key values such as \(t\), \(\pi\), and \(2\pi\), indicating the period of the sine wave.
- The graph visually represents the concept of the definite integral of the sine function over various intervals.