Long description: block2fig1
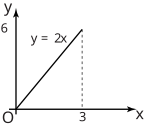
Alt text: A graph of the linear function \(y=2x\) over the interval from \(x=0\) to \(x=3\).
This description was generated by AI and has not been verified by a human. If you spot an error, please use the feedback link below.
- The image displays a Cartesian coordinate system with a line graph representing the function \(y=2x\).
- The horizontal axis is labeled \(x\), and the vertical axis is labeled \(y\).
- The graph includes markings along both axes, with visible values including \(0\), \(3\), and \(6\) on the vertical axis.
- The plotted line starts at the origin \((0, 0)\) and increases linearly.
- A dashed vertical line extends from the point where \(x=3\) up to the point on the line where \(y=6\), indicating the endpoint of the function over the specified domain.
- The domain shown for the function is \(0 \text{ less than or equal to } x \text{ less than or equal to } 3\).