Long description: block2fig4
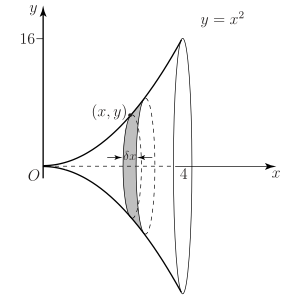
Alt text: A graph illustrating the method of slicing to find the volume of a solid of revolution, showing thin circular cross-sections.
This description was generated by AI and has not been verified by a human. If you spot an error, please use the feedback link below.
- The image displays a two-dimensional Cartesian coordinate system with the horizontal axis labeled \(x\) and the vertical axis labeled \(y\), both marked with units.
- A curve defined by the equation \(y = x^2\) is drawn, passing through the origin \((0, 0)\).
- The region bounded by the \(x\)-axis and the curve \(y = x^2\) is shown. A representative point \((x, y)\) is marked on the curve.
- A thin vertical rectangular strip, representing an infinitesimal slice of thickness \(\Delta x\), is drawn at the point \((x, y)\).
- Perpendicular to the \(x\)-axis, a thin, shaded rectangular cross-section is shown at the point \((x, y)\). This cross-section is depicted as a thin circle (a disk) perpendicular to the \(x\)-axis.
- Several instances of these thin, dashed and solid circular slices are drawn along the curve, illustrating the concept of slicing.
- The graph is configured to show the volume generated by revolving the area under \(y = x^2\) around the \(x\)-axis, conceptually divided into these thin circular discs.