Long description: workbook16block3fig1
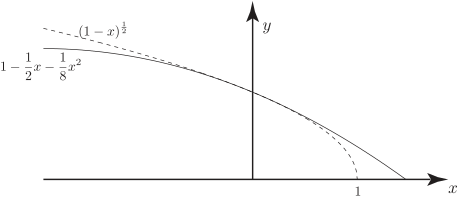
Alt text: The graph shows two curves, one solid and one dashed, plotted against the x and y axes, with the x-intercept at x=1.
This description was generated by AI and has not been verified by a human. If you spot an error, please use the feedback link below.
- The graph displays a two-dimensional coordinate system with a horizontal x-axis and a vertical y-axis.
- Two functions are plotted on this graph: a dashed curve and a solid curve.
- The dashed curve is labeled as \(\left(1-x\right)^{1/2}\).
- The solid curve is labeled as \(1-\frac{1}{2}x-\frac{1}{8}x^2\).
- Both curves are decreasing as the value of \(x\) increases from the origin.
- Both curves intersect the x-axis at the point \((1, 0)\).
- The graph illustrates the relationship between the binomial expansion and its approximation for \(x\) values between 0 and 1.