Long description: workbook16block3fig2
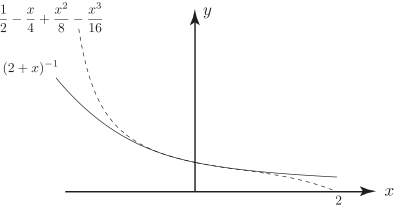
Alt text: The graph shows two curves plotted on a coordinate system, representing functions of x.
This description was generated by AI and has not been verified by a human. If you spot an error, please use the feedback link below.
- The horizontal axis is labeled with 'x', and the vertical axis is labeled with 'y'.
- Two curves are visible on the coordinate plane.
- The solid curve appears to be a general function, passing through the y-axis at a positive value and decreasing as x increases.
- The dashed curve is another function, also decreasing as x increases, and appears to have a vertical asymptote near the y-axis.
- There is a label positioned near the top left of the graph that reads \(\frac{1}{2} - \frac{x}{4} + \frac{x^2}{8} - \frac{x^3}{16}\).
- The expression \( (2+x)^{-1} \) is written near the top left corner, suggesting the solid curve might represent this function or a related form.