Long description: fig4
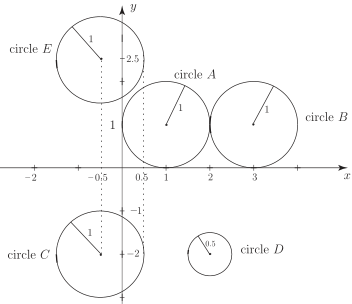
Alt text: A graph showing four circles labeled E, A, B, and C, positioned relative to the x and y axes.
This description was generated by AI and has not been verified by a human. If you spot an error, please use the feedback link below.
- The image displays a two-dimensional coordinate system with labeled x and y axes, ranging at least from -2 to 3 on the x-axis and from -2 to 2.5 on the y-axis.
- Circle E is drawn on the left side of the y-axis, centered near x = -1.5 and y = 0. The circle has a vertical dashed line passing through it at x = -0.5 and a horizontal dashed line passing through it at y = 2.5.
- Circle A is drawn in the first quadrant, centered near (1.5, 0). It has a horizontal dashed line passing through it at y = 1 and a vertical dashed line passing through it at x = 0.5.
- Circle B is drawn to the right of Circle A, also in the first quadrant, centered near (2.5, 0). It has a horizontal dashed line passing through it at y = 1 and a vertical dashed line passing through it at x = 1.
- Circle C is drawn on the negative y-axis, centered near (0, -1.5). It has a horizontal dashed line passing through it at y = -2 and a vertical dashed line passing through it at x = -0.5.
- Circle D is drawn in the first quadrant, centered near (0.5, 0). It appears to be the smallest of the four circles, with no apparent dashed lines passing through it in the visible area.