Long description: fig6
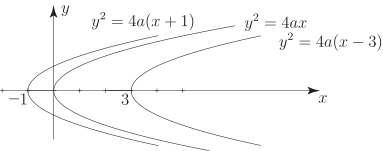
Alt text: A graph showing several parabolas, all opening to the right, plotted on a Cartesian coordinate system.
This description was generated by AI and has not been verified by a human. If you spot an error, please use the feedback link below.
- The image displays a Cartesian coordinate system with the horizontal axis labeled as \(x\) and the vertical axis labeled as \(y\).
- Several parabolas are drawn, all opening towards the positive \(x\)-direction.
- The equations corresponding to the graphed parabolas are listed near the top of the image: \(y^2 = -4a(x + 1)\), \(y^2 = -4ax\), and \(y^2 = -4a(x - 3)\).
- The graph illustrates a family of parabolas of the form \(y^2 = k(x - h)\), where the focus appears to be at a position determined by the constant \(a\) in the equations provided.