Long description: fig7
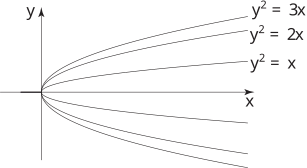
Alt text: The image displays several curves plotted on a coordinate plane, representing parabolas of the form \(y^2 = kx\) for different values of \(k\).
This description was generated by AI and has not been verified by a human. If you spot an error, please use the feedback link below.
- The visualization is set on a standard two-dimensional Cartesian coordinate system with the horizontal axis labeled \(x\) and the vertical axis labeled \(y\).
- Several curves are drawn, opening to the right from the origin \((0, 0)\).
- These curves appear to be parabolas, each labeled with an equation: \(y^2 = 3x\), \(y^2 = 2x\), and \(y^2 = x\).
- The parabola \(y^2 = x\) is the uppermost visible curve, opening in the positive \(x\)-direction.
- Following downward, the curve for \(y^2 = 2x\) is plotted below the first one, and the curve for \(y^2 = 3x\) is plotted lowest among the labeled curves, maintaining the parabolic shape as \(x\) increases to the right.