Long description: fig8
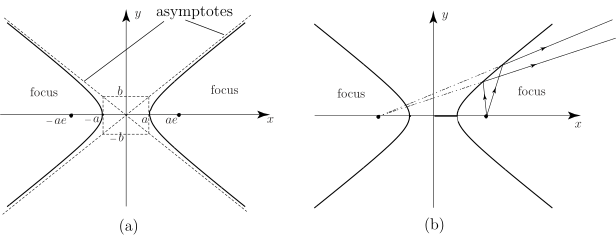
Alt text: Two graphs, (a) and (b), illustrating the shapes of hyperbolic curves with labeled features like foci and asymptotes.
This description was generated by AI and has not been verified by a human. If you spot an error, please use the feedback link below.
- Graph (a) shows two separate branches of a hyperbola opening horizontally along the x-axis, with dashed lines representing the asymptotes and labeled points for the foci at emoveMath{\( -ae \text{ and } ae \text{ on the x-axis}}.
- Graph (b) shows two separate branches of a hyperbola opening vertically along the y-axis, with dashed lines representing the asymptotes and labeled points for the foci on the x-axis.