Long description: fig4_3
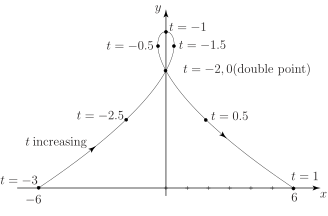
Alt text: A graph showing a curve plotted using parametric equations, with several labeled points indicating the parameter values.
This description was generated by AI and has not been verified by a human. If you spot an error, please use the feedback link below.
- The image displays a coordinate plane with an x-axis and a y-axis, representing a graph of a curve.
- Several points are marked on the curve, each labeled with a parameter value (t).
- The curve passes through labeled points corresponding to parameter values such as \(t=-3\), \(t=-2.5\), \(t=-1\), \(t=-0.5\), \(t=-2.0\) (labeled as a double point), \(t=-1.5\), \(t=0.5\), and \(t=1\).
- Arrows and text indicate the direction of motion or increasing parameter values along the curve at various sections, such as "t increasing" near \(t=-2.5\) and near the x-axis intercept labeled \(t=-3\).
- The curve appears to be symmetric with respect to the y-axis in the region shown, forming a parabolic or similar shape that crosses the x-axis at \(t=-3\) and \(t=1\) (relative to the parameterization).