Long description: fig5_3
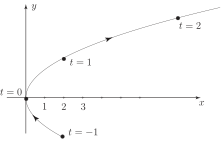
Alt text: The image displays a graph with a curved line segment passing through the origin, illustrating a path parameterized by time, with labeled points for different values of the parameter.
This description was generated by AI and has not been verified by a human. If you spot an error, please use the feedback link below.
- The image is a two-dimensional Cartesian coordinate system with the horizontal axis labeled \(x\) and the vertical axis labeled \(y\).
- A smooth curve is drawn on the plane, suggesting a path traced out over time.
- Points on the curve are marked and labeled with specific values of a parameter, \(t\), representing time.
- At \(t = 0\), the curve passes through the origin, \((0, 0)\).
- As \(t\) increases to \(t = 1\) and \(t = 2\), the curve moves into the first quadrant, generally increasing in both \(x\) and \(y\) coordinates.
- For negative values of \(t\), such as \(t = -1\), the curve is shown continuing in a path below the \(x\)-axis and to the right of the origin, indicating that the path covers multiple sections relative to the origin.