Long description: fig6_3
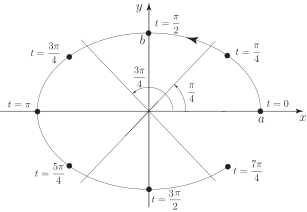
Alt text: A diagram illustrates the parametrization of a circle using the variable parameter \(t\) on the horizontal axis, ranging from \(t=0\) to \(t=2\text{pi}\).
This description was generated by AI and has not been verified by a human. If you spot an error, please use the feedback link below.
- The image displays a circle centered at the origin, plotted on a Cartesian coordinate system with the horizontal axis labeled \(a\) and the vertical axis labeled \(b\).
- Several points are marked on the circle, each corresponding to a specific value of the parameter \(t\).
- The parameter \(t\) is shown on a radial scale originating from the center, indicating angular positions around the circle.
- Specific labeled points on the circle include those corresponding to \(t=0\), \(t=\frac{\text{pi}}{4}\), \(t=\frac{\text{pi}}{2}\), \(t=\frac{3\text{pi}}{4}\), \(t=\text{pi}\), \(t=\frac{5\text{pi}}{4}\), and \(t=\frac{7\text{pi}}{4}\).
- Angles are indicated at the center of the circle, with measures such as \(\frac{\text{pi}}{4}\) radians being shown between adjacent marked points.