Long description: figf
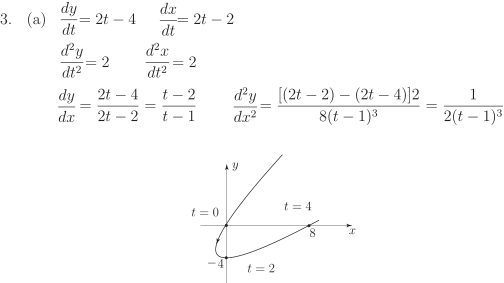
Alt text: A graph showing a parametric curve with several labeled points and values for the parameter t.
This description was generated by AI and has not been verified by a human. If you spot an error, please use the feedback link below.
- The image displays a coordinate plane with an x-axis and a y-axis, illustrating a curve defined by parametric equations.
- The curve starts from a point where the parameter t equals zero, and this initial point is labeled with t = 0.
- Another labeled point on the curve corresponds to a value of t = 4.
- A horizontal line segment or implied path suggests a point at t = 2.
- The curve passes through or is near points labeled with x-coordinates of -4, 8, and y-coordinates labeled with values corresponding to the parameter t.