Long description: fig1a
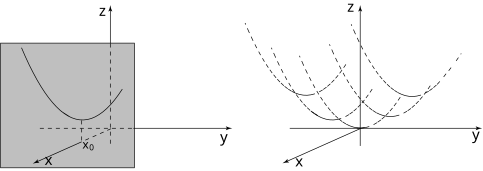
Alt text: A graph shows the cross-section of a three-dimensional function, represented by a parabola in the cross-section, and the resulting plot in the \(z\) versus \(y\) plane.
This description was generated by AI and has not been verified by a human. If you spot an error, please use the feedback link below.
- The image consists of two parts side-by-side, illustrating a function of several variables.
- On the left, a shaded area shows a cross-section defined by \(z\) on the vertical axis and \(x\) on the horizontal axis. A parabolic curve is visible in this cross-section, with the curve passing through a point labeled \(x_0\) on the horizontal axis.
- On the right, a graph shows the function plotted in the \(z\) versus \(y\) plane. This plot consists of several dashed parabolas, illustrating the function's shape across different values of \(y\). The parabolas are concave up, and they appear to form a smooth, curving surface as \(y\) changes.