Long description: fig3a
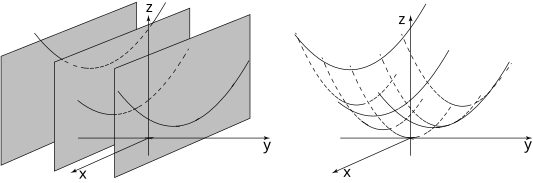
Alt text: The image shows three overlapping, curved surfaces in three-dimensional space, with the second panel illustrating several downward-opening parabolas in a two-dimensional plane.
This description was generated by AI and has not been verified by a human. If you spot an error, please use the feedback link below.
- The left side displays a visualization of functions of two variables, represented by three stacked, curved surfaces, suggesting a process of cross-sectioning or slicing through a volume.
- The coordinate axes are labeled \(x\), \(y\), and \(z\), indicating a three-dimensional Cartesian system.
- The right side displays a graph in two-dimensional space with labeled axes \(x\) and \(z\).
- Multiple dashed and solid curves are drawn on this plane, illustrating several downward-opening parabolic curves, representing cross-sections of the function visualized on the left.