Long description: fig4a
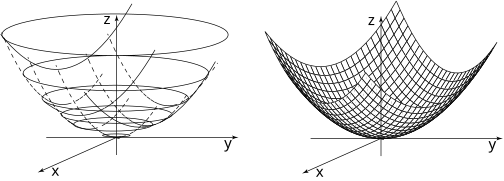
Alt text: Two graphs are shown side-by-side: the left graph shows cross-sections of a paraboloid, and the right graph shows the three-dimensional surface of a paraboloid.
This description was generated by AI and has not been verified by a human. If you spot an error, please use the feedback link below.
- The left panel displays a set of nested, elliptical curves plotted in the \(x-y\) plane, representing cross-sections of a downward-opening paraboloid shape along the \(z\)-axis.
- Several dashed curves are visible, suggesting the intersection of the surface with horizontal planes at different values of \(z\).
- The right panel displays a continuous, three-dimensional surface, which is a paraboloid, opening upwards along the positive \(z\)-axis.
- Both graphs are set against a three-dimensional coordinate system with labeled axes for \(x\), \(y\), and \(z\).