Long description: stat1
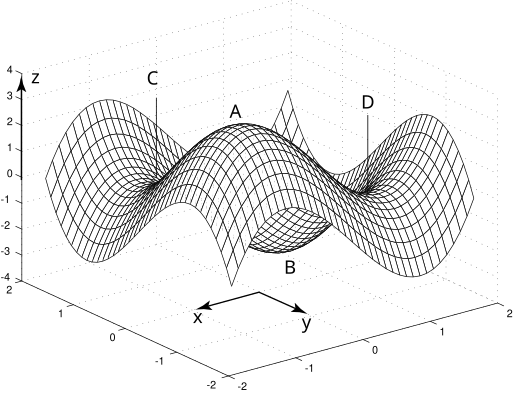
Alt text: A three-dimensional surface plot showing four marked points labeled A, B, C, and D on a wavy surface defined over the x and y axes.
This description was generated by AI and has not been verified by a human. If you spot an error, please use the feedback link below.
- The image displays a three-dimensional plot of a function, where the horizontal plane represents the x and y axes, and the vertical axis represents the function's value, labeled z.
- The surface itself resembles a wave or saddle shape, varying across the depicted domain.
- Four specific points of interest are marked on the surface and labeled: A, B, C, and D.
- Point A is located in a region where the surface appears to be a local maximum or saddle point, with z having a positive value.
- Point B is located in a trough or valley, indicating a local minimum, where z has a negative value.
- Point C is situated in a peak region, marked as a local maximum, where the z value is positive.
- Point D is located near the edge of the plotted area, marking another peak or crest on the surface, with a positive z value.