Long description: stat3
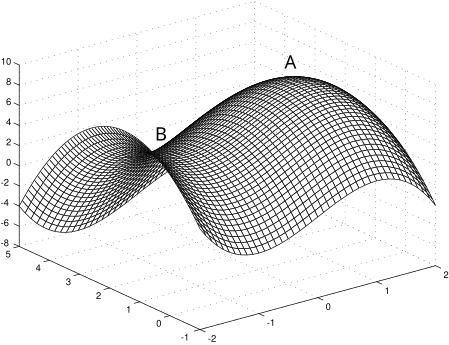
Alt text: A three-dimensional plot showing a surface with two distinct local extrema labeled A and B.
This description was generated by AI and has not been verified by a human. If you spot an error, please use the feedback link below.
- The image displays a three-dimensional surface plot, which appears to represent a mathematical function, plotted over an area in the \(xy\)-plane.
- The surface exhibits a shape resembling a trough or a wave, with the height plotted on the vertical axis.
- There are two distinct regions marked on the surface: one labeled A, which represents a local maximum or peak, and another labeled B, which represents a local minimum or trough.
- Region A is located in the upper right portion of the visible plot area, where the surface reaches a relatively high elevation.
- Region B is located in the left portion of the plot area, where the surface dips to a lower elevation, forming a visible valley or trough.
- The overall plot suggests a function with at least two critical points, one corresponding to a maximum and one corresponding to a minimum.