Long description: figout1
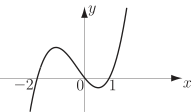
Alt text: The graph shows a smooth, S-shaped curve plotted on an x-y coordinate plane, appearing to be a sigmoid function.
This description was generated by AI and has not been verified by a human. If you spot an error, please use the feedback link below.
- The graph is plotted on a standard two-dimensional Cartesian coordinate system with the horizontal axis labeled as \(x\) and the vertical axis labeled as \(y\).
- The curve is continuous and smooth, resembling a sigmoid function or a logistic growth curve.
- The curve passes through the origin, or very close to it, at the point \((0, 0)\) or slightly above it.
- To the left of the y-axis (for negative \(x\) values), the function's value, \(y\), increases rapidly from a low negative value towards a peak, then gradually flattens.
- As \(x\) increases through negative values, the curve exhibits an initial segment that rises, reaches a peak around \(x=-1\), and then begins to decrease.
- Passing through the region near \(x=0\), the curve's slope changes dramatically, passing through an inflection point where the rate of change appears maximal.
- To the right of the y-axis (for positive \(x\) values), the curve increases sharply, maintaining an increasing positive slope that appears to level off as \(x\) increases further, suggesting an asymptote at a high positive \(y\) value.