Long description: figout3
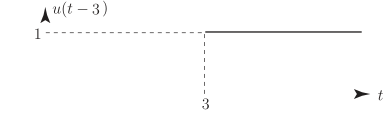
Alt text: The graph shows a unit step function shifted to the right by three units, labeled \(\u_\mathrm{A}(t-3)\).
This description was generated by AI and has not been verified by a human. If you spot an error, please use the feedback link below.
- The image displays a graph representing the unit step function, denoted as \(\u_\mathrm{A}(t-3)\).
- The function is characterized by a horizontal dashed line that starts at the point labeled \(1\) on the horizontal axis and continues indefinitely to the right.
- The vertical axis represents the function's value, and the horizontal axis represents the time variable, \(t\).
- The function value is zero for time values less than \(1\) and increases abruptly to one at time \(t=1\), remaining at a value of \(1\) for all time \(t \ge 1\).
- The horizontal axis is marked with the value \(3\), indicating the time shift applied to the standard unit step function \(\u_\mathrm{A}(t)\).