Long description: figout4
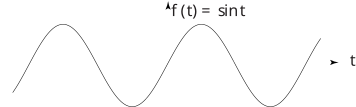
Alt text: A graph illustrating the sinusoidal function \(\text{̂}f(t) = \text{sin}t\).
This description was generated by AI and has not been verified by a human. If you spot an error, please use the feedback link below.
- The image displays a continuous, oscillating wave function plotted on a standard two-dimensional coordinate system.
- The function is labeled mathematically above the graph as \(\text{̂}f(t) = \text{sin}t\), indicating a sine wave where \(t\) represents time.
- The horizontal axis represents time, labeled with an arrow pointing to \(t\).
- The vertical axis represents the function's value, \(\text{̂}f(t)\).
- The curve itself smoothly traces the characteristic pattern of a sine wave, showing one complete cycle of oscillation across the visible domain.