Long description: figout5
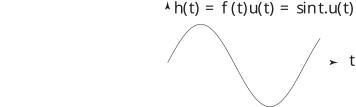
Alt text: The image displays a continuous, oscillating sine wave graph plotted against time.
This description was generated by AI and has not been verified by a human. If you spot an error, please use the feedback link below.
- The graph shows a smooth, sinusoidal wave oscillating up and down.
- The horizontal axis represents time, denoted by the variable \(t\).
- The vertical axis represents the function's value, \( ilde{h}(t) = f(t)u(t) = \text{sin}t \text{u}(t)\).
- The wave form appears to be a standard sine function, starting at zero when \(t\) is at or before zero, and continuing to oscillate for positive values of \(t\).