Long description: figout6
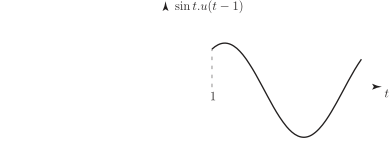
Alt text: A graph showing a smooth, wave-like curve labeled as ≡ sin(t-1), plotted against the variable t.
This description was generated by AI and has not been verified by a human. If you spot an error, please use the feedback link below.
- The image displays a two-dimensional graph illustrating a continuous, periodic function.
- The function is labeled at the top as ≡ sin(t-1), suggesting it is a sinusoidal wave shifted one unit to the right compared to a standard sine function.
- The horizontal axis represents the variable t, and the vertical axis represents the function's output.
- The curve itself is smooth, starting from a high point on the left, decreasing to a minimum value, passing through a point where the function's value is one, and then increasing again toward the right, characteristic of a sine or cosine wave.