Long description: figout7
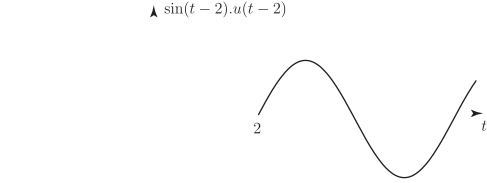
Alt text: The graph shows a sinusoidal function, \text{sin}(t-2)u(t-2), which is zero for time values less than 2 and follows a sine wave pattern for time values greater than or equal to 2.
This description was generated by AI and has not been verified by a human. If you spot an error, please use the feedback link below.
- The graph plots a function of time, indicated by the horizontal axis labeled with 't'.
- The function being graphed is \(\text{sin}(t-2)u(t-2)\).
- The graph remains at a horizontal line on the time axis for values of 't' less than 2.
- Starting at \(t=2\), the graph begins to rise following a sinusoidal wave pattern.
- The wave reaches a peak, then crosses the time axis, reaches a trough, and then continues to rise, demonstrating the characteristic shape of a sine wave that is delayed by 2 units in time.