Long description: figout7a
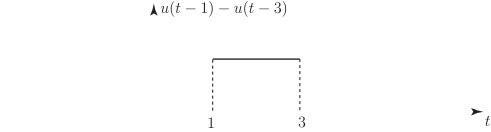
Alt text: A diagram representing the difference between two unit step functions, shown as a dashed line segment from one to three.
This description was generated by AI and has not been verified by a human. If you spot an error, please use the feedback link below.
- The image displays the expression \(\Delta u(t-1) - u(t-3)\) above a graphical representation.
- The graph consists of a dashed, horizontal line segment spanning from the value of one on the horizontal axis to the value of three on the horizontal axis.
- The function \(u(t)\) represents the unit step function, and the displayed graph illustrates a difference between two such functions at different time shifts.