Long description: figout9
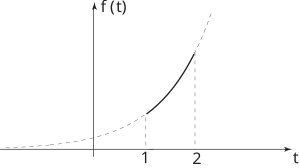
Alt text: The image displays a graph of a function, f of t, plotted against time t, showing a concave up curve with a dashed curve underneath.
This description was generated by AI and has not been verified by a human. If you spot an error, please use the feedback link below.
- The graph has two axes: the horizontal axis represents time, t, and the vertical axis represents the function, f of t.
- A solid, continuous curve is drawn on the graph, increasing as time t increases, and appears to be concave up.
- A dashed curve is drawn underneath the solid curve, also increasing with time t, and appears to be concave up, lying below the solid curve across the visible domain.
- Vertical dashed lines are present at t equals one and t equals two, marking specific points on the time axis.