Long description: figout10
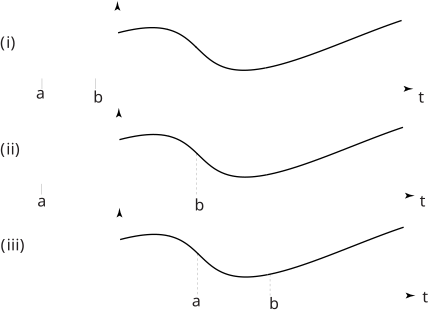
Alt text: The image displays three graphs, labeled (i), (ii), and (iii), illustrating curves plotted against an x-axis, with labeled points on the horizontal axis as 'a', 'b', and 't'.
This description was generated by AI and has not been verified by a human. If you spot an error, please use the feedback link below.
- The first graph, labeled (i), shows a curve that starts with a downward slope, reaches a minimum between the marked points 'a' and 'b', and then curves upward towards the point 't'.
- The second graph, labeled (ii), displays a curve that is concave down in the initial segment, curves through a point between 'a' and 'b', and then curves upward towards 't'.
- The third graph, labeled (iii), presents a smooth, curved line that reaches a minimum between the marked points 'a' and 'b', and increases steadily as it moves toward 't'.