Long description: Fig1Colin1
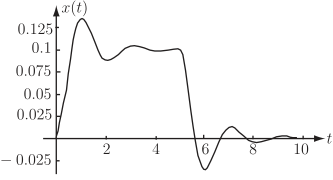
Alt text: A graph showing a function \(x(t)\) plotted against time \(t\), which exhibits oscillations that decrease in amplitude over time.
This description was generated by AI and has not been verified by a human. If you spot an error, please use the feedback link below.
- The graph displays a function \(x(t)\) on the vertical axis and time \(t\) on the horizontal axis.
- At time \(t=0\), the function value \(x(t)\) starts at zero.
- The function increases rapidly, reaching a peak slightly above \(0.125\) around \(t=1\).
- Between \(t=1\) and \(t=3\), the function oscillates, with the peak value remaining relatively close to \(0.1\) for a period.
- The oscillations continue, showing a general decreasing trend in amplitude.
- Around \(t=6\), the function reaches a negative minimum value, falling below \(-0.025\).
- After \(t=7\), the amplitude of the oscillations continues to decrease, approaching the horizontal axis, suggesting the function approaches zero as \(t\) increases towards \(10\).