Long description: zfig1
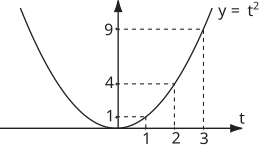
Alt text: The graph shows a parabola opening upwards with its vertex at the origin, and it passes through the point (3, 9).
This description was generated by AI and has not been verified by a human. If you spot an error, please use the feedback link below.
- The image displays a coordinate plane with the horizontal axis labeled with 't' and the vertical axis with numerical markings, suggesting a function \(y\) of \(t\).
- A smooth, U-shaped curve, characteristic of a parabola, is drawn, indicating a decreasing value as \(t\) approaches zero from the negative side, reaches a minimum near the origin, and then increases sharply as \(t\) increases.
- A horizontal dashed line is drawn at a value of \(y=4\).
- A vertical dashed line is drawn passing through \(t=3\).
- A horizontal dashed line is drawn connecting the point \((3, 9)\), indicating that when \(t=3\), the value of \(y\) is \(9\), as shown by the label \(y=t^2\) near that point.