Long description: zfig2
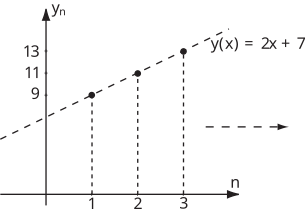
Alt text: A graph plotting discrete points and a dashed line representing the function \(y(n) = 2n + 7\).
This description was generated by AI and has not been verified by a human. If you spot an error, please use the feedback link below.
- The image displays a two-dimensional Cartesian coordinate system with the horizontal axis labeled \(n\) and the vertical axis labeled \(y_n\).
- A dashed line, which represents the function \(y(n) = 2n + 7\), is drawn across the plot.
- Several discrete points are plotted on the graph, corresponding to integer values of \(n\).
- The first visible point is plotted at \(n=1\), where the corresponding \(y\)-value is \(9\).
- A second point is plotted at \(n=2\), where the corresponding \(y\)-value is \(11\).
- A third point is plotted at \(n=3\), where the corresponding \(y\)-value is \(13\).
- Dashed vertical lines are drawn from each plotted point down to the horizontal axis, emphasizing the discrete nature of the sampled points.