Long description: zfig24
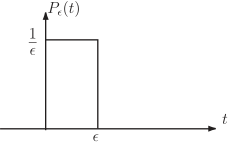
Alt text: The graph shows a function, \(P_{\epsilon}(t)\), that is equal to one over epsilon for the interval from zero to epsilon, and zero elsewhere.
This description was generated by AI and has not been verified by a human. If you spot an error, please use the feedback link below.
- The image displays a two-dimensional graph with the horizontal axis labeled \(t\) and the vertical axis labeled \(P_{\epsilon}(t)\).
- A rectangular shape is drawn on the graph, indicating the function's value.
- The function \(P_{\epsilon}(t)\) has a constant value of \(\frac{1}{\epsilon}\) for the time interval from \(t=0\) to \(t=\epsilon\).
- For all values of \(t\) outside the interval \([0, \epsilon]\), the function's value is zero.