Long description: zfig25
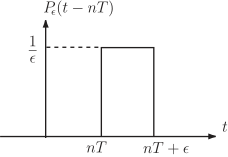
Alt text: A graph showing a rectangular pulse function that starts at time \(nT\) and ends at time \(nT + \frac{1}{\text{constant}}\), with a height of \(\frac{1}{\text{constant}}\) on the vertical axis.
This description was generated by AI and has not been verified by a human. If you spot an error, please use the feedback link below.
- The graph displays a function, \(P_{\text{e}}(t - nT)\), plotted on a two-dimensional coordinate system.
- The horizontal axis represents time, denoted by \(t\), and the vertical axis represents the value of the function, with a labeled maximum value of \(\frac{1}{\text{constant}}\).
- A rectangular pulse is drawn starting at the time \(nT\) on the horizontal axis.
- This pulse has a constant height, indicated by a dashed line at \(\frac{1}{\text{constant}}\) on the vertical axis.
- The pulse extends horizontally from the time \(nT\) up to an unlabelled but specific point on the axis, forming a distinct rectangular shape above the time axis.