Long description: zfig26
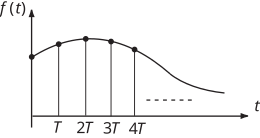
Alt text: A graph showing a periodic function that transitions into an exponentially decaying curve over time.
This description was generated by AI and has not been verified by a human. If you spot an error, please use the feedback link below.
- The vertical axis represents the function \(f(t)\) and the horizontal axis represents time \(t\).
- The function starts with a series of discrete, uniform peaks, suggesting a periodic or sampled signal.
- There are marked points on the horizontal axis at time \(T\), \(2T\), \(3T\), and \(4T\), corresponding to the peaks.
- From the time \(t=0\) up to approximately \(t=4T\), the function exhibits a relatively constant height at each integer multiple of \(T\).
- After \(t=4T\), the function smoothly transitions into a decaying curve, dropping towards zero as time increases.