Long description: Block6fig1
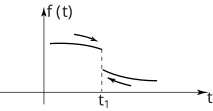
Alt text: A graph showing a function f(t) that decreases rapidly at time t equals t₁.
This description was generated by AI and has not been verified by a human. If you spot an error, please use the feedback link below.
- The vertical axis is labeled with the function f(t), and the horizontal axis is labeled with time t.
- The graph depicts a curve representing f(t) that starts at a certain height before the vertical dashed line at t₁.
- To the left of t₁, the curve shows a relatively high value for f(t) with an arrow indicating a slight downward trend.
- At the vertical dashed line marked t₁, the function f(t) undergoes a sharp and rapid decrease.
- To the right of t₁, the curve continues to decrease but at a slower rate, indicated by the continuing downward slope and arrow.