Long description: Block6fig2
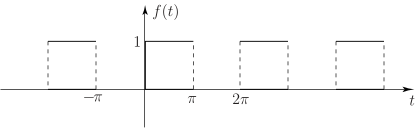
Alt text: The image displays a periodic square wave function, \(f(t)\), plotted against the time variable, \(t\).
This description was generated by AI and has not been verified by a human. If you spot an error, please use the feedback link below.
- The horizontal axis represents the variable \(t\), and the vertical axis represents the function value, \(f(t)\).
- The graph shows a repeating pattern of a square wave, which is a function that alternates between a high value and a low value.
- Specifically, the function is at a height of \(1\) over the interval from \(-\text{pi}\) to \(-\text{pi}\) (the units on the axes are implied to be dimensionless or periodic units).
- The function remains at a height of \(1\) over the interval from \(\text{pi}\) to \(2\text{pi}\).
- A subsequent segment at height \(1\) is visible over an interval centered around \(3\text{pi}\), and another segment at height \(1\) is visible continuing to the right, indicating the periodic nature of the function.