Long description: Block6fig3
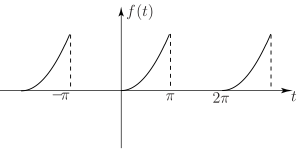
Alt text: The image displays a graph of a function, \(f(t)\), composed of three distinct, wave-like segments plotted against the time variable, \(t\).
This description was generated by AI and has not been verified by a human. If you spot an error, please use the feedback link below.
- The graph shows the function \(f(t)\) plotted on the vertical axis against the variable \(t\) on the horizontal axis.
- The horizontal axis is marked with values, including \(-\text{pi}\), \(\text{pi}\), and \(2\text{pi}\).
- The function appears to be defined piecewise or sampled at three distinct intervals, each segment showing a curve that starts near the horizontal axis, rises to a peak, and then drops back down.
- The first segment is located over the interval leading up to \(-\text{pi}\).
- The second segment is plotted between \(-\text{pi}\) and \(\text{pi}\), showing an increasing curve.
- The third segment is plotted between \(\text{pi}\) and \(2\text{pi}\), also showing an increasing curve that peaks near \(2\text{pi}\).
- All three segments resemble a portion of a wave function, suggestive of periodic behavior or convergence over time.