Long description: Block5fig1
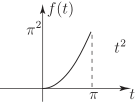
Alt text: A graph showing a curve of the function \(f(t)\) starting at the origin and increasing as \(t\) approaches \(\text{pi}^2\).
This description was generated by AI and has not been verified by a human. If you spot an error, please use the feedback link below.
- The image displays a two-dimensional Cartesian coordinate system with the horizontal axis labeled \(t^2\) and the vertical axis labeled \(f(t)\).
- A smooth, monotonically increasing curve represents the function \(f(t)\), which starts at the origin \((0, 0)\).
- The curve continues to rise as the value of \(t^2\) increases along the horizontal axis.
- A dashed vertical line is drawn at \(t^2 = \text{pi}\), indicating a specific value on the independent variable axis.