Long description: Block5fig2
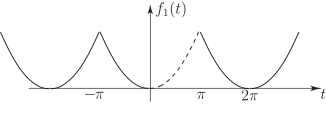
Alt text: The image displays a graph of a function, \(f_1(t)\), plotted against time, \(t\), spanning from \(-3\text{pi}\) to \(3\text{pi}\).
This description was generated by AI and has not been verified by a human. If you spot an error, please use the feedback link below.
- The graph plots the function \(f_1(t)\) on the vertical axis against the variable \(t\) on the horizontal axis, with labeled points at \(-\text{pi}\), \(0\), \(\text{pi}\), and \(2\text{pi}\).
- For negative values of \(t\), the function shows a continuous, wave-like pattern of cosine-like oscillations, appearing to be defined or drawn solid in this region.
- Specifically, between \(t = -\text{pi}\) and \(t = \text{pi}\), the solid line depicts the function completing two full cycles, suggesting a defined periodic behavior.
- Starting at \(t = \text{pi}\), the graph transitions to a dashed line segment representing the function's values. This dashed segment shows the function beginning a curve that resembles a cosine wave segment.
- The solid line segment appears to cover the interval from some value less than \(-\text{pi}\) up to at least \(t = \text{pi}\).
- The dashed line continues the pattern to the right, passing through \(t = 2\text{pi}\) and continuing to increase towards \(3\text{pi}\), maintaining the curved, wave-like shape visible in the solid section.