Long description: Block5fig3
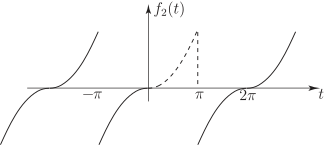
Alt text: A graph showing a periodic function, f_2(t), plotted against time, t, over an interval from negative pi to positive two pi.
This description was generated by AI and has not been verified by a human. If you spot an error, please use the feedback link below.
- The graph displays a function labeled \(f_2(t)\) on the vertical axis and the variable \(t\) on the horizontal axis.
- The horizontal axis is marked with key values at \(-\pi\), \(0\), \(\pi\), and \(2\pi\).
- The graph shows a solid curve that appears to be periodic, resembling a cosine or similar wave shape, plotted across the entire visible domain.
- Within the interval between \(-\pi\) and \(\pi\), a dashed curve illustrates the function's behavior, starting at a value and rising towards a peak near \(t=\pi/2\), before decreasing.
- Specifically, at \(t=-\pi\), the solid curve crosses the horizontal axis. At \(t=\pi\), the dashed curve reaches its maximum height and then drops.
- The graph suggests a function that is defined piecewise or is being analyzed over a specific range, contrasting the solid plotted line with the dashed representation, particularly around the interval containing \(\pi\).