Long description: Block5fig4
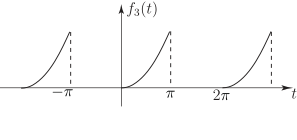
Alt text: The image shows a graph of the function \(f_3(t)\) plotted over a period from negative pi to positive two pi, consisting of three distinct parabolic segments.
This description was generated by AI and has not been verified by a human. If you spot an error, please use the feedback link below.
- The graph displays a function labeled \(f_3(t)\) on the vertical axis against the variable \(t\) on the horizontal axis.
- The horizontal axis is marked with values at negative pi, pi, and two pi.
- Three distinct, curved segments, resembling parabolic arcs, are visible across the plotted domain.
- The first segment is situated between negative pi and pi, showing the function rising from a low value near negative pi to a peak near zero.
- The second segment is visible between zero and two pi, depicting the function rising from a low value near zero to a peak near two pi.
- The overall pattern suggests a piecewise function composed of these three smoothly connected curves across the interval from negative pi to two pi.