Long description: Block5fig5
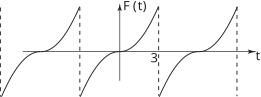
Alt text: The graph shows a continuous, periodic function plotted against time, represented by the function \(F(t)\).
This description was generated by AI and has not been verified by a human. If you spot an error, please use the feedback link below.
- The horizontal axis represents time, denoted by \(t\).
- The vertical axis represents the function value, denoted by \(F(t)\).
- The graph displays a smooth, wave-like curve oscillating around the horizontal axis.
- The function appears to be symmetrical and reaches zero at the vertical axis at \(t=0\).
- Several vertical dashed lines are present, suggesting specific time intervals or points of interest across the curve's domain.
- The curve passes through zero, reaches a local maximum (positive \(F(t)\)) between the first and second dashed lines, crosses the axis, reaches a local minimum (negative \(F(t)\)) between the second and third dashed lines, and then passes through zero again at the vertical position corresponding to \(t=0\).
- The visible portion of the graph suggests a pattern of repeating oscillations over time.