Long description: Block5fig8
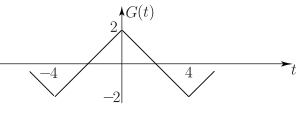
Alt text: A graph of the function \(G(t)\) versus time \(t\), showing a triangular wave shape centered at the origin.
This description was generated by AI and has not been verified by a human. If you spot an error, please use the feedback link below.
- The graph plots the function \(G(t)\) on the vertical axis against time \(t\) on the horizontal axis.
- The function forms a triangular shape, peaking at a maximum value of \(2\) when \(t=0\).
- The function decreases linearly from its peak at \(t=0\) until it reaches a value of \(0\) at \(t=-2\) and again at \(t=2\).
- The graph shows the function remaining at a value of \(0\) outside the interval from \(t=-2\) to \(t=2\).
- The overall shape resembles a tent function or a triangle centered at the origin, with the peak value being \(2\).