Long description: figure9
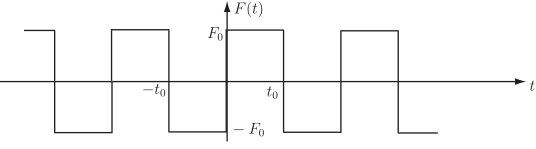
Alt text: A graph showing a periodic square wave function, labeled F(t), plotted against time, t.
This description was generated by AI and has not been verified by a human. If you spot an error, please use the feedback link below.
- The graph displays a function, labeled F(t), as a square wave pattern over time, labeled t on the horizontal axis.
- The function has repeating positive and negative rectangular pulses.
- The waveform appears to have a period, and the amplitude of the positive pulses is labeled with an amplitude value, \(F_0\).
- The amplitude of the negative pulses is labeled with an amplitude value of \(-F_0\).
- The waveform's pattern repeats across the displayed time interval, which includes markings for \(-t_0\) and \(t_0\) on the horizontal axis.